Infographics

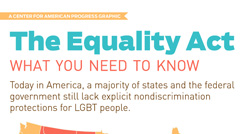
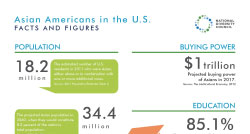
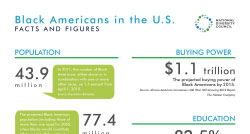
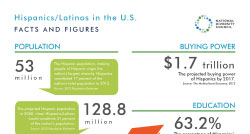
Our DEI infographics combine visuals with facts, statistics and trends on a variety of groups and topics – all delivered through the eye of knowledgeable sources. Digest information quickly with our shareable infographics.
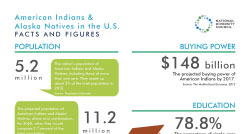 Infographic: American Indians & Alaska Natives in the U.S. – Facts and Figures
Posted: June 12, 2014
NOTE: Infographics by the National Diversity Council are shareable. The toolkit content is best viewed in either Google Chrome or Mozilla Firefox.

